Image Details
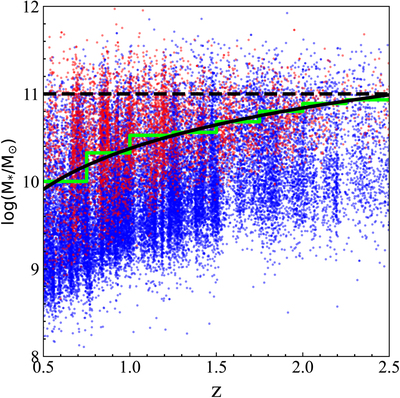
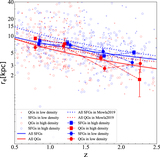
Caption: Figure 2.
Stellar mass as a function of redshift for the parent sample of this work. The red and blue dots represent star-forming and quiescent galaxies, respectively. The lime step-like line shows the mass completeness limits for QGs in the redshift interval Δz = 0.25. The mass completeness limit can be parameterized as the function ﹩{M}_{{\rm{comp}}}(z)=10.375+0.671\,{\rm{ln}}(z)﹩ in this study, which is shown by the black solid curve. The black dashed line is M ⋆ = 1011 M ⊙, which marks the lower mass limit of our sample.
Other Images in This Article
Copyright and Terms & Conditions
© 2023. The Author(s). Published by the American Astronomical Society.
Copyright ©
2025 Astronomy Image Explorer. All Rights Reserved.