Image Details
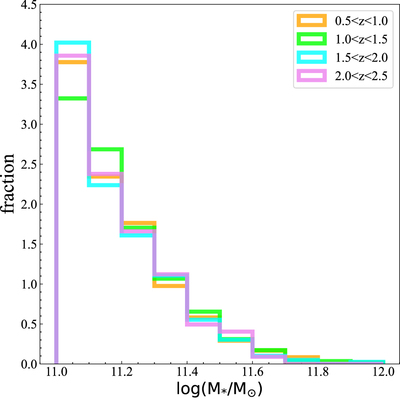
Caption: Figure 3.
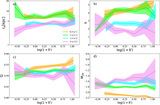
Distribution of stellar mass in different redshift bins. Orange, lime, aqua, and violet histograms represent galaxy stellar mass distribution at 0.5 < z < 1.0, 1.0 < z < 1.5, 1.5 < z < 2.0, and 2.0 < z < 2.5 respectively.
Other Images in This Article
Copyright and Terms & Conditions
© 2023. The Author(s). Published by the American Astronomical Society.
Copyright ©
2025 Astronomy Image Explorer. All Rights Reserved.