Image Details
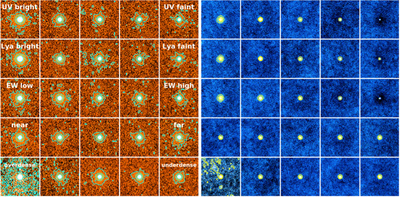
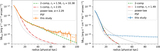
Caption: Figure 10.
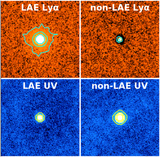
Stacked Lyα (left, orange) and continuum (right, blue) images of different subsamples in the asinh color stretch. From top to bottom, we show stacked images of UV magnitude, L Lyα , EW0,Lyα , distance from the HLQSO, and environment subsamples. From left to right, median [UV magnitude, L Lyα , EW0,Lyα , distance from the HLQSO, δ] of each subsample respectively become [fainter, fainter, larger, larger, smaller]. The size of each image is ∼200 × 200 pkpc. Contours correspond to ﹩3\times {10}^{-18},1\times {10}^{-18},1\times {10}^{-19}\,\mathrm{erg}\,{{\rm{s}}}^{-1}\,{\mathrm{cm}}^{-2}\,{\mathrm{arcsec}}^{-2}﹩ in the Lyα images and ﹩3\times {10}^{-31},1\times {10}^{-31},3\times {10}^{-32}\,\mathrm{erg}\,{{\rm{s}}}^{-1}\,{\mathrm{cm}}^{-2}\,{\mathrm{Hz}}^{-1}\,{\mathrm{arcsec}}^{-2}﹩ in continuum images.
Other Images in This Article

Show More
Copyright and Terms & Conditions
© 2023. The Author(s). Published by the American Astronomical Society.