Image Details
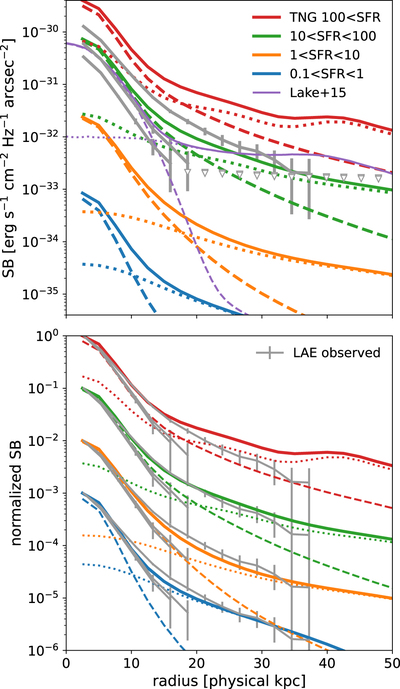
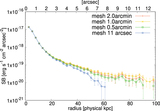
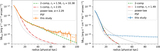
Caption: Figure 16.
Top: SFR surface density profiles of TNG100 galaxies converted to UV SB profiles (thick colored solid curves; see text). Different colors show different SFR bins. Dashed and dotted curves show contributions to the profiles from the main halo and other halos, respectively. The thin purple curve shows that predicted in Lake et al. (2015). Gray curves with error bars are observed UV SB profiles of our three UV-brightest LAE subsamples. These profiles are corrected for a slight redshift dimming effect by scaling (1 + z)3/(1 + 2.845)3. Bottom: curves of top panels are normalized to better compare their shapes.
Other Images in This Article

Show More
Copyright and Terms & Conditions
© 2023. The Author(s). Published by the American Astronomical Society.