Image Details
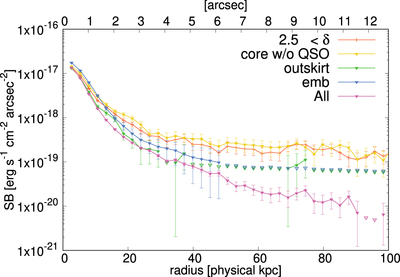
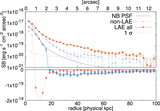
Caption: Figure 15.
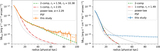
Stacked Lyα SB profiles of the protocluster (δ > 2.5) sample (orange), the core sample (yellow), the outskirt sample (green), embedded and stacked image (blue; see text), and all LAEs (purple, same as Figure 7). Downward triangles show 1σ error levels after residual sky subtraction.
Other Images in This Article

Show More
Copyright and Terms & Conditions
© 2023. The Author(s). Published by the American Astronomical Society.
Copyright ©
2025 Astronomy Image Explorer. All Rights Reserved.