Image Details
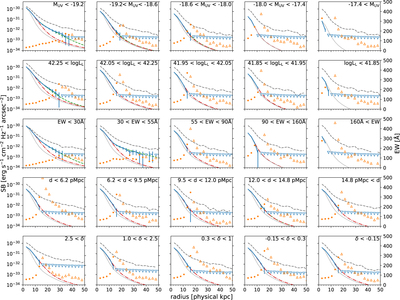
Caption: Figure 12.
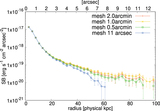
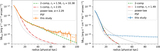
Radial UV SB profiles of all subsamples (specified in Table 1, solid blue curve with error bars) with fitting curves. Green dashed and red dotted–dashed curves show the result of fitting with two- and one-component exponential functions. The gray dashed curve is Lyα SB profiles converted from F Lyα units to f ν units by simply dividing by the FWHM of the NB filter. Orange dot indicates rest-frame Lyα equivalent width in Å calculated in each annulus, with its value on the right axis. Downward and upward triangles show 1σ limits of UV emission and equivalent width (some data points in the rightmost panels are above the upper boundary) after residual sky subtraction. Thin gray curve shows the normalized PSF shape. Note the difference in the range of the x-axis from that of Figure 11.
Other Images in This Article

Show More
Copyright and Terms & Conditions
© 2023. The Author(s). Published by the American Astronomical Society.