Image Details
Caption: Figure A1.
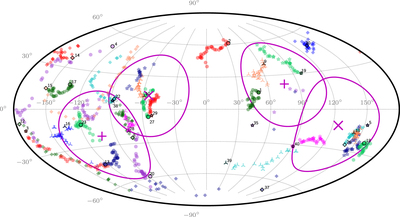
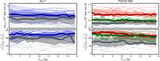
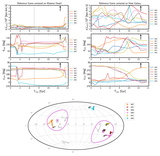
Same content as Figure 2(a), but for the PDEVA-5004 system: Aitoff projection of the stacked orbital poles for the whole set of PDEVA-5004 satellites. Different colors correspond to different satellite tracks. Within a given color, each point corresponds to a simulation output, that is, different values of the universe age, T uni, from T vir to T z=0. Two J stack axes are identified, marked with large crosses (KPP1) and plus signs (KPP2). The IDs of satellites in each KPP plane can be read in Table 1. For more details, see descriptions corresponding to Figure 2(a).
Other Images in This Article

Copyright and Terms & Conditions
© 2023. The Author(s). Published by the American Astronomical Society.