Image Details
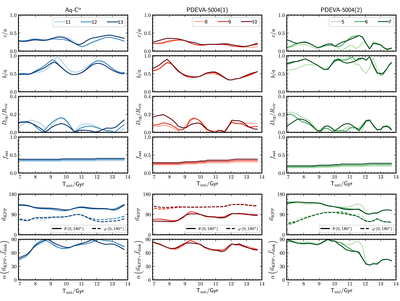
Caption: Figure 4.
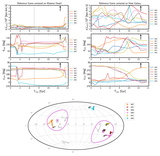
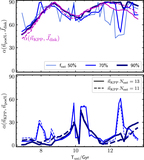
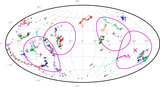
Time evolution of the planes formed by the groups of kinematically coherent satellites identified in each simulation; see Table 1. Left: Aq-C α . Middle: PDEVA-5004 (1) (group corresponding to the main J stack axis). Right: PDEVA-5004 (2) (group corresponding to the second axis). Panels in the upper block show the TOI plane parameters (See Section 5.1). Panels in the lower block show the time evolution of the normal vectors to the KPPs, n KPP, in spherical θ, φ angular components with respect to a fixed reference frame, and the angle α formed between n KPP and the spin vector of the central galaxy J disk. Colored lines of different shades stand for subsamples of satellites out of the total kinematically coherent group with a different number of satellites N sat, as indicated in the legend, following the N co−orb ordering from Table 1.
Other Images in This Article

Copyright and Terms & Conditions
© 2023. The Author(s). Published by the American Astronomical Society.