Image Details
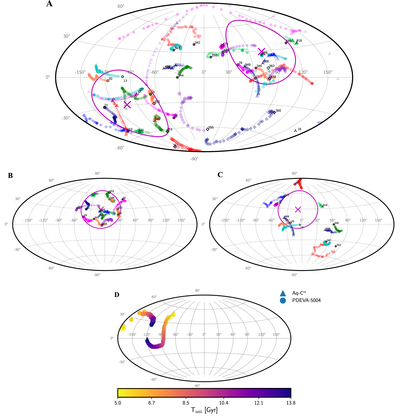
Caption: Figure 2.
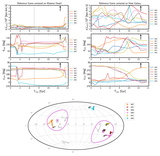
Aitoff projections. (a) Orbital poles (i.e., the J orb directions) for the whole Aq-C α satellite sample. Satellite identities are specified through point type and color, and different points stand for different output times from T vir to T z=0. Satellite ID numbers are given next to their trace point corresponding to z = 0. Crosses mark the (axial) axis of maximum satellite co-orbitation, J stack. These crosses are diametrically opposite. The circle around each of them encloses the co-orbiting directions, i.e., those directions at angular distances closer than α co−orbit = 36.°87 from each axis. Satellites falling within these circles orbit on a common orbital plane, rotating in one sense or in the contrary sense. (b, c) Results of KPP satellite membership determination by means of the stacking method. In these plots only the poles relative to those satellites involved in the stacking procedure are drawn (i.e., those with well-conserved orbital angular momentum; see Section 4.1): (b) satellites belonging to the KPP (second column of Table 1), and (c) satellites outside the former structure. In these panels, J orb are considered as axial vectors and are represented in just one hemisphere. In addition, orbital poles have been rotated 60° in longitude with respect to panel (a) for a clearer visualization. Satellite IDs are specified using the same symbols and colors as in panel (a). (d) Time evolution of the central galaxy’s spin vector J disk relative to a fixed reference frame, for both Aq-C α (triangles) and PDEVA-5004 (circles). Different colors stand for different output times, as encoded in the bar.
Other Images in This Article
Copyright and Terms & Conditions
© 2023. The Author(s). Published by the American Astronomical Society.