Image Details
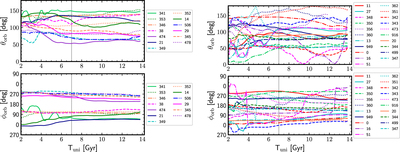
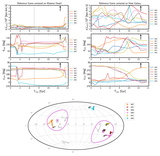
Caption: Figure 1.
The angular components of the J orb vector of each satellite, as a function of time, for satellites in the Aq-C α simulation. Satellite samples are divided according to belonging (left panels) or not (right panels) to KPPs; see Table 1, second column. Vertical lines mark the halo virialization time, T vir, i.e., roughly the moment when the halo decouples from cosmic expansion. Satellite IDs are color-coded in the legends.
Other Images in This Article

Copyright and Terms & Conditions
© 2023. The Author(s). Published by the American Astronomical Society.
Copyright ©
2025 Astronomy Image Explorer. All Rights Reserved.