Image Details
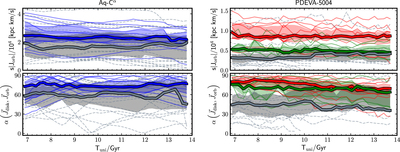
Caption: Figure 5.
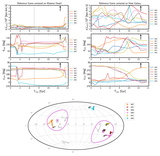
Time evolution of properties of the kinematically coherent satellites identified in each simulation. Left: Aq-C α ; right: PDEVA-5004. Top panels show the magnitude of the specific orbital angular momentum sJ orb, and bottom panels show the angle formed between the spin vector of the central disk galaxy and the orbital pole of satellites, ﹩\alpha \left({{\boldsymbol{J}}}_{\mathrm{disk}},{{\boldsymbol{J}}}_{\mathrm{orb}}\right)﹩. Thin lines show results for individual satellites, shown in color for kinematically coherent satellites (blue for the main group in Aq-C α , red and green for the main and second groups in PDEVA-5004, respectively), or in dashed gray for nonkinematically coherent ones. Following the same color scheme, a thick line with shade indicates the median and the 25th–75th percentile range, calculated at each time step.
Other Images in This Article

Copyright and Terms & Conditions
© 2023. The Author(s). Published by the American Astronomical Society.