Image Details
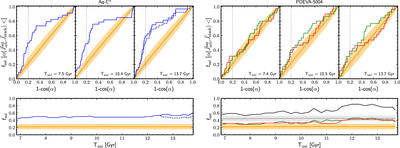
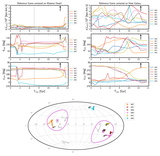
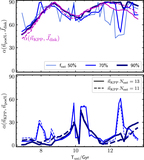
Caption: Figure 3.
Top panels: fraction of satellites with orbital poles J orb enclosed within an angle α measured from the co-orbitation axes J stack, at given time steps. Each panel indicates the universe age T uni. Left: Aq-C α ; right: PDEVA-5004 (measured from main J stack axis in red, from second axis in green). The orange lines with shaded bands give the results when the method is applied to isotropized configurations of orbital poles (see Appendix C), specifically the averages and 1σ dispersion band over N random = 5000 randomized realizations. Gray dotted diagonal lines stand for the analytical result for a homogeneously sampled sphere. A vertical line marks the satellite co-orbitation criterion adopted in this work, i.e., an angle of α co−orb = 36.°87 (see text). The dashed line for Aq-C α represents the situation when including the lately captured MD and its subsatellites. Bottom panels: Time evolution of the fraction of satellites with orbital poles within an angle of α co−orb from the respective J stack axes (i.e., the fraction of “co-orbiting” satellites). For PDEVA-5004, a black line shows the total co-orbiting fraction by summing up contributions from the red and green lines, and a gray line and band indicate the corresponding isotropization mean and scatter to compare it to.
Other Images in This Article

Copyright and Terms & Conditions
© 2023. The Author(s). Published by the American Astronomical Society.