Image Details
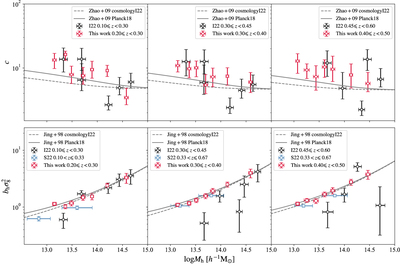
Caption: Figure 6.
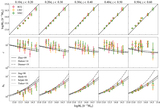
We compare our concentration and bias measurements to previous observations by I22 and S22, using different types of symbols, with average redshift of each sample within 0.2 ≤ z < 0.6. Here, we only show the results in three redshift bins, within 0.2 ≤ z < 0.5. We present the theoretical predictions under the Planck18 cosmology with the solid lines and the prediction under the cosmology obtained in I22 with the dashed lines.
Other Images in This Article

Copyright and Terms & Conditions
© 2022. The Author(s). Published by the American Astronomical Society.
Copyright ©
2025 Astronomy Image Explorer. All Rights Reserved.