Image Details
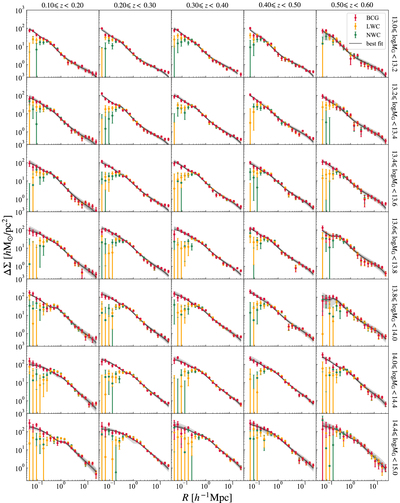
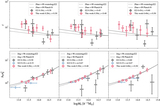
Caption: Figure 2.
The ESD of the DESI Legacy Imaging Surveys DR9 lens samples in different redshift and mass bins, as indicated, in different columns and rows. In each panel, we compare the results for three different group center indicators. The red points represent the results for the BCG group center, orange those for the LWC, and green those for the NWC. We can see that the BCG performs best as a center indicator. The solid line in each panel shows the best-fit model (Equation (7)) of the ESD for the BCG centroid. The dark and light gray shaded regions represent the 68% and 95% confidence regions of the ESD fitting results, respectively.
Other Images in This Article

Copyright and Terms & Conditions
© 2022. The Author(s). Published by the American Astronomical Society.