Image Details
Caption: Figure 1.
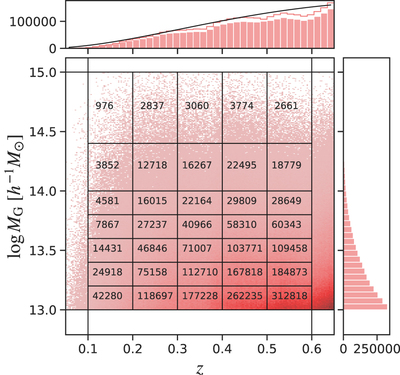
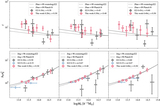
The distribution of the group/cluster sample in the redshift and mass proxy space. The x-axis is the redshift and the y-axis is the group mass. The black solid lines label the thresholds of our redshift and mass bins. The numbers in each block are the numbers of groups. The top and right panels show the number distributions of the groups using 1D shaded histograms, according to the redshift and group mass, respectively. In the top panel, we also provide the number distributions of the groups after the completeness correction (see Equation (14)), using a red histogram, and the theoretical prediction of the number distribution of halos with mass larger than 1013 h −1 M ⊙ under Planck18 cosmology using a black line (Tinker et al. 2008).
Other Images in This Article

Copyright and Terms & Conditions
© 2022. The Author(s). Published by the American Astronomical Society.