Image Details
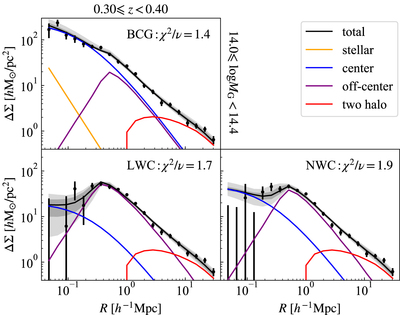
Caption: Figure 3.
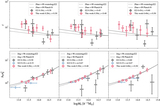
The best-fit results and different model components for a lens sample with mass ﹩14.0\leqslant \mathrm{log}{M}_{{\rm{G}}}\lt 14.4﹩ at redshift 0.3 ≤ z < 0.4. The dark and light gray shaded regions represent the 68% and 95% confidence intervals of the total ESD fitting results, respectively. The three panels correspond to the three different types of group center. The different colored lines represent the halo components labeled in the legend. The χ 2/ν value is also provided in each panel. Note that the degrees of freedom have a value of ν = 15 here.
Other Images in This Article

Copyright and Terms & Conditions
© 2022. The Author(s). Published by the American Astronomical Society.
Copyright ©
2025 Astronomy Image Explorer. All Rights Reserved.