Image Details
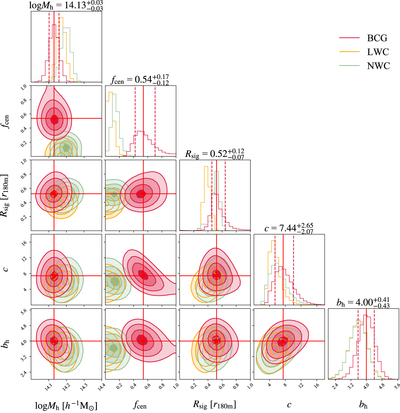
Caption: Figure 4.
An example of the marginalized posterior distributions of the five parameters ﹩\mathrm{log}{M}_{{\rm{h}}}﹩, R sig, f cen, c, and b h for the lens sample with mass ﹩14.0\leqslant \mathrm{log}{M}_{{\rm{G}}}\lt 14.4﹩ at redshift 0.3 ≤ z < 0.4. Here, the red, orange, and green contours show the results for BCG, LWC, and NWC centroids, respectively. The solid red lines show the best-fit results for the BCG sample. The dashed red lines show the 1σ confidence intervals.
Other Images in This Article

Copyright and Terms & Conditions
© 2022. The Author(s). Published by the American Astronomical Society.
Copyright ©
2025 Astronomy Image Explorer. All Rights Reserved.