Image Details
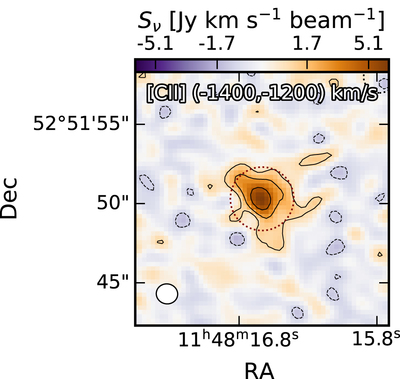
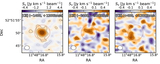
Caption: Figure 22.
[C II]158 μm line map integrated over ( − 1400, + 1200) km s−1 using the previous PdBI data. The (dashed) black contours are at the ( − 2, 2, 4, 8)σ level, where σ is the rms computed directly from the map with σ-clipping. The extended [C II]158 μm structure reported in Cicone et al. (2015) is recovered, albeit at a lower significance level (see the main text for details).
Other Images in This Article

Show More
Copyright and Terms & Conditions
© 2022. The Author(s). Published by the American Astronomical Society.
Copyright ©
2025 Astronomy Image Explorer. All Rights Reserved.