Image Details
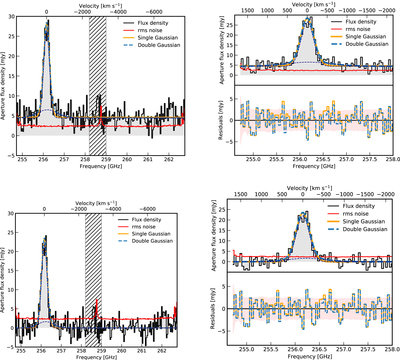
Caption: Figure 5.
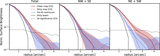
The total (top panels) and continuum-subtracted (bottom panels) spectra of the [C II]158 μm line (black), extracted in a r = 3″ aperture using residual scaling and one- and two-component Gaussian fits (the orange line and the dashed–dotted blue line, respectively). The thin dashed dark blue lines show the two components of the double-Gaussian model. Both models are fitted to the entire frequency range, with the exception of the overlap between the two sidebands that is coincident with an atmospheric absorption feature (hatched in gray) and the 262 GHz feature (see the text). The right panels show a zoomed-in version of the left plots and the residuals of the two models. The shaded red areas in the bottom of the right panels show the 1σ noise level, computed using the rms noise in each channel in mJy beam−1 with the sigma-clipping scaled accordingly for the number of beams in the r = 3″ aperture. The median noise level at νobs > 263 GHz is 2.36 ± 0.14 mJy, whereas a direct rms estimate from the continuum-subtracted spectrum at the same frequencies gives 2.00 ± 0.15 mJy. We find no evidence for a broad [C II]158 μm emission line in the new NOEMA data (see the text for details).
Other Images in This Article

Show More
Copyright and Terms & Conditions
© 2022. The Author(s). Published by the American Astronomical Society.