Image Details
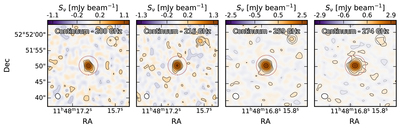
Caption: Figure 1.
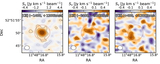
Dust continuum emission maps integrated over the ∼7.68 GHz effective bandwidth of the Polyfix correlator for each sideband, with central frequencies 200, 216, 259, and 274 GHz. The dotted circle centered on J1148+5251 indicates the aperture radius of 3″ adopted throughout this paper for flux density estimates. An additional source, reported previously by Leipski et al. (2010) and Cicone et al. (2015), is visible to the NW in the three higher-frequency bands at ∼10″ (the black dotted circle). The contours are logarithmic ( − 4, − 2, 2, 4, 8, 16, 32)σ (rms). The color scaling is log-linear, the threshold being at 3σ.
Other Images in This Article

Show More
Copyright and Terms & Conditions
© 2022. The Author(s). Published by the American Astronomical Society.