Image Details
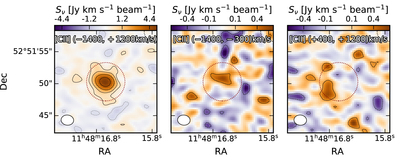
Caption: Figure 8.
From left to right: a map of the [C II]158 μm emission, averaged over the velocity ranges (−1400, 1200) km s−1, (−1400, 300) km s−1, and (+400, +1200) km s−1. These velocity ranges are similar to those presented in Cicone et al. (2015), who reported 6σ [C II]158 μm clumps at 2″–4″ from the source center in the blue-/redshifted wings of the [C II]158 μm emission. Such spatially and spectrally offset emission is not recovered in the NOEMA data. The 1σ rms values in the above three maps are 0.27, 0.14, and 0.15 mJy beam−1. This figure shows contours in logarithmic increments (−4, −2, 2, 4, 8, 16, 32)σ (rms).
Other Images in This Article

Show More
Copyright and Terms & Conditions
© 2022. The Author(s). Published by the American Astronomical Society.