Image Details
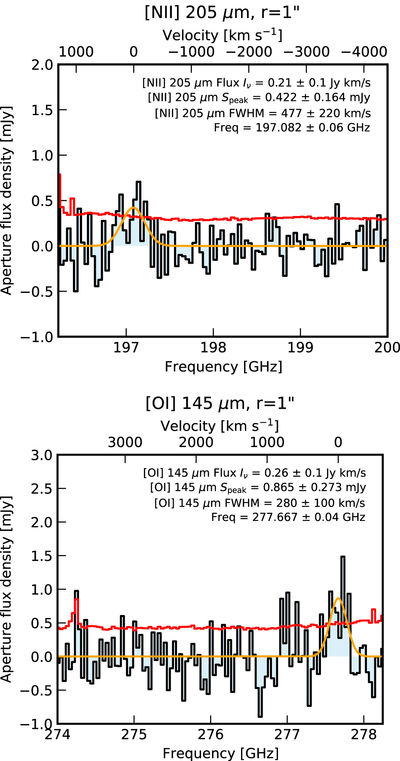
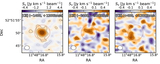
Caption: Figure 4.
Continuum-subtracted spectrum of the [N II]205 μm (upper panel) and [O I]146 μm (lower panel). The spectra (black lines, shaded blue) are extracted in r = 1″ apertures centered on the peak of the emission in the velocity-integrated maps (Figure 3) using residual scaling (see Section 2). The 1σ noise level per channel for an r = 1″ aperture is shown in red, and a single-Gaussian fit is shown in orange (the best-fit parameters and uncertainties are in the upper right corners).
Other Images in This Article

Show More
Copyright and Terms & Conditions
© 2022. The Author(s). Published by the American Astronomical Society.
Copyright ©
2025 Astronomy Image Explorer. All Rights Reserved.