Image Details
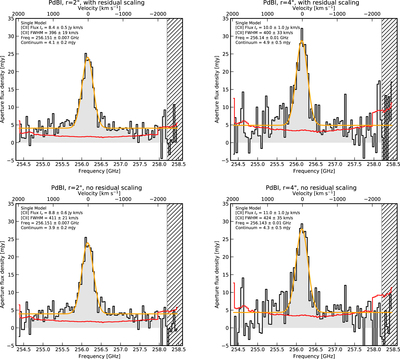
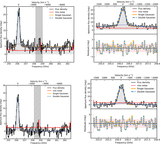
Caption: Figure 20.
The total spectra of the [C II]158 μm line, with (first row) and without (second row) residual scaling, extracted in r = 2″ and r = 4″ apertures (the first and second columns, respectively), in the PdBI data. The single-Gaussian (+continuum) fits to both data sets are shown in orange. In the absence of residual scaling, the continuum flux drops away from the [C II]158 μm line in the larger apertures (see the text for details). Even though no continuum was subtracted in the UV plane, the continuum flux approaches ∼ 0 mJy at the band edges in the r = 4″ aperture (without residual scaling), creating the illusion of a broad emission line.
Other Images in This Article

Show More
Copyright and Terms & Conditions
© 2022. The Author(s). Published by the American Astronomical Society.