Image Details
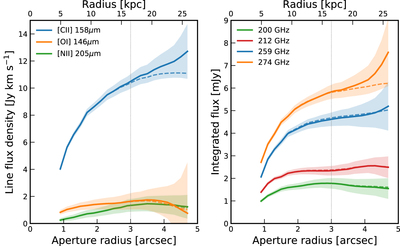
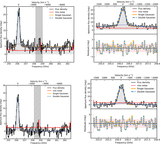
Caption: Figure 12.
FSL flux densities (left panel) and integrated continuum flux (right panel) as a function of aperture radius. The solid and dashed lines show the fluxes with and without residual scaling correction (see Section 2), respectively. The final aperture radius of 3″ was chosen to encompass all of the [C II]158 μm emission and the continuum at the higher frequencies.
Other Images in This Article

Show More
Copyright and Terms & Conditions
© 2022. The Author(s). Published by the American Astronomical Society.
Copyright ©
2025 Astronomy Image Explorer. All Rights Reserved.