Image Details
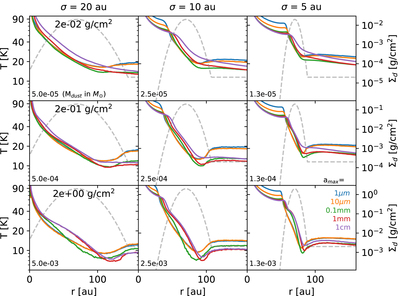
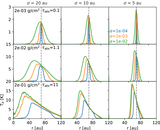
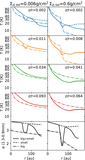
Caption: Figure 5.
The midplane temperature of one-population models with ring configurations. From top to bottom, the dust surface densities at the Gaussian peak are 0.02, 0.2, and 2 g cm−2. From left to right, the Gaussian widths are 20, 10, and 5 au. ﹩{a}_{\max }﹩ with increasing sizes are marked with blue, orange, green, red, and magenta lines. The dashed lines are the dust surface densities in logarithmic scale. The floor density over the peak density is 10−3. The total dust mass is shown in the bottom left corner.
Other Images in This Article
Copyright and Terms & Conditions
© 2021. The American Astronomical Society. All rights reserved.
Copyright ©
2025 Astronomy Image Explorer. All Rights Reserved.