Image Details
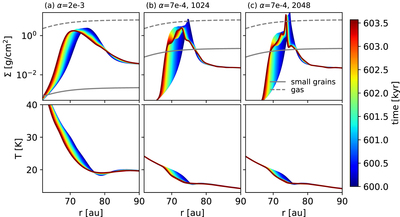
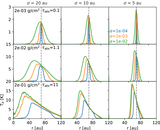
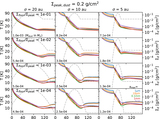
Caption: Figure 10.
Dust surface density of the big-grain population (top panels) and midplane temperature (bottom panels). (a) Model with α = 2 × 10⁻³, Σg = 4.1 g cm−2, ϵ = 0.01 at the ring. (b), (c) Models with α = 7 × 10⁻⁴ and with different radial resolutions. In these models small grains’ surface density is 100 × higher than that in model (a). The small grains’ densities are marked by gray solid curves and gas surface densities are marked by gray dashed curves.
Other Images in This Article
Copyright and Terms & Conditions
© 2021. The American Astronomical Society. All rights reserved.
Copyright ©
2025 Astronomy Image Explorer. All Rights Reserved.