Image Details
Caption: Figure 1.
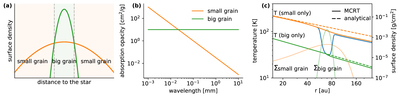
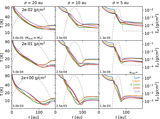
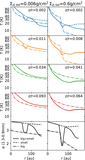
(a) The surface density of the toy model. The small (big) grain is represented by the orange (green) curve. The big grain has a narrower width and dominates inside the ring (green), whereas the small grain dominates outside the ring. (b) The absorption-only opacity used for the toy model. The big grain is represented by a constant opacity, whereas the small grain is represented by a opacity ∝ ν1.5. (c) The temperature calculations. The orange (green) curves show temperature if the disk only has small (big) grains. The solid lines are calculations from RADMC-3D MCRT, and the dashed lines are analytical solutions assuming optical thinness. The small grain has a higher equilibrium temperature at the outer disk. The MCRT result when including both species is represented by the blue curve. The temperature approaches the small grain’s outside the ring and approaches the big grain’s inside the ring. Their respective surface density profiles are marked in transparent colors.
Other Images in This Article
Copyright and Terms & Conditions
© 2021. The American Astronomical Society. All rights reserved.