Image Details
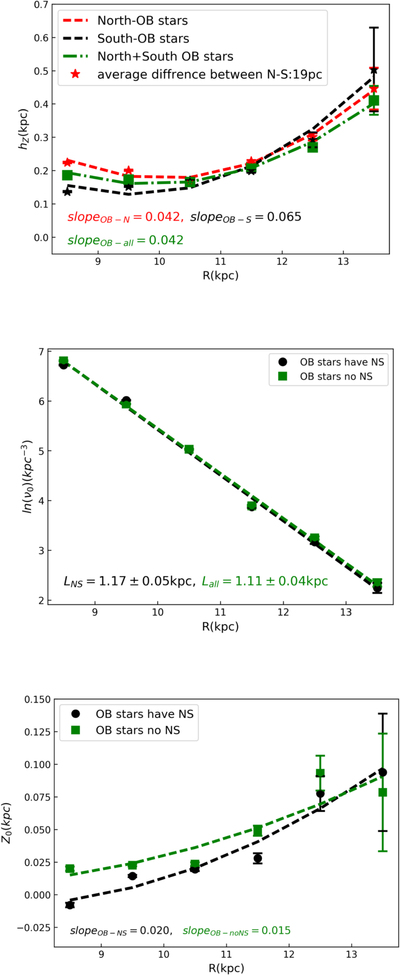
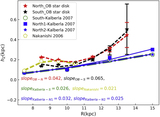
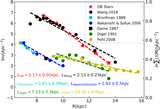
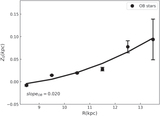
Caption: Figure 7.
Comparison of the disk parameters determined using the north and south sides to values found without considering the scale heights of the north and south sides simultaneously, which are indicated by red or black pentagrams and green squares, respectively. The top panel shows the scale height, and the middle one shows the midplane density, with the slope of the scale height and scale length versus the distance labeled. The bottom panel shows the midplane offsets with the slopes labeled; clearly, the pattern is stable.
Other Images in This Article

Copyright and Terms & Conditions
© 2021. The American Astronomical Society. All rights reserved.
Copyright ©
2025 Astronomy Image Explorer. All Rights Reserved.