Image Details
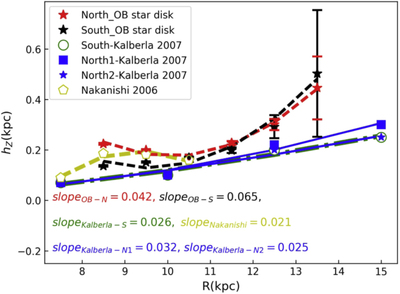
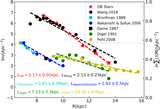
Caption: Figure 4.
The figure shows the OB-type star scale height distribution compared with the gas disk as a function of the radial distance. The red line is the north-side scale height, and the black line is the southern scale height. The green line is the Kalberla et al. (2007) southern scale height of the H I gas disk, while the blue rectangles and pentagram are also the Kalberla et al. (2007) northern H I thickness distribution. Yellow pentagrams correspond to the H2 results in Nakanishi & Sofue et al. (2006). The average slope of the scale height (h z ) versus distance (R) describing the strength of flaring is labeled in the bottom left.
Other Images in This Article

Copyright and Terms & Conditions
© 2021. The American Astronomical Society. All rights reserved.