Image Details
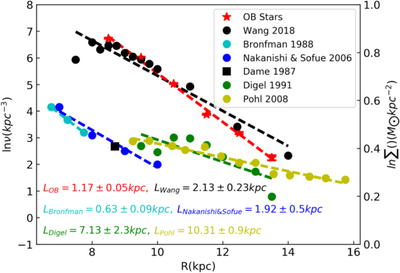
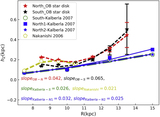
Caption: Figure 5.
The figure shows the midplane density distribution as a function of distance. The linear fitting results are shown as dashed lines with different colors; the scale lengths of different works for the H2 gas disk (Dame et al. 1987; Bronfman et al. 1988; Digel 1991; Nakanishi & Sofue et al. 2006; Pohl et al. 2008) are labeled in the bottom left, and the H2 value is converted from CO (Heyer & Dame 2015). The left y-axis corresponds to the stellar disk and the right axis is the gas surface density. The gas density is adjusted by shifting up 5.5, and the Wang et al. (2018b) values are shifted up 10 in order to compare in one figure.
Other Images in This Article

Copyright and Terms & Conditions
© 2021. The American Astronomical Society. All rights reserved.