Image Details
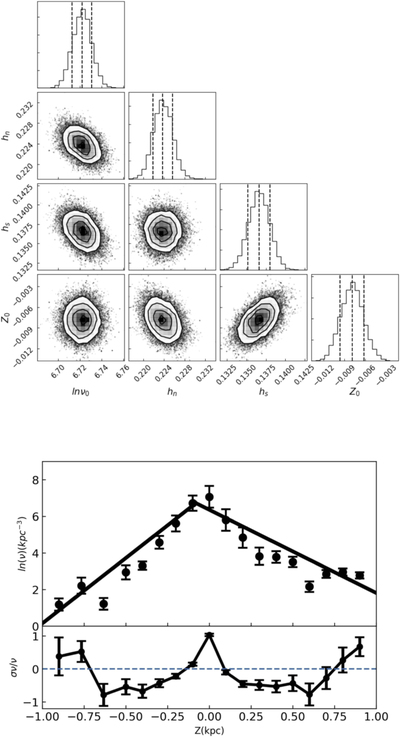
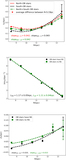
Caption: Figure 2.
The top panel shows the likelihood distribution of the parameters (﹩{ln}({\nu }_{0})﹩; (kpc−3), h z ( kpc), and Z 0 ( kpc)) for 8–9 kpc, drawn from the MCMC simulation. The uncertainties in the estimates are determined using the 15th and 85th percentiles of the MCMC samples. The bottom panel shows the fitting results and relative errors of the model and data. It appears that there are some oscillations in the solar neighborhood.
Other Images in This Article

Copyright and Terms & Conditions
© 2021. The American Astronomical Society. All rights reserved.
Copyright ©
2025 Astronomy Image Explorer. All Rights Reserved.