Image Details
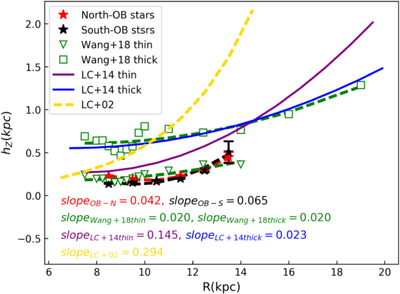
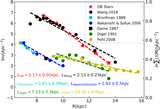
Caption: Figure 3.
The figure shows the scale-height distribution of OB-type stars and other tracers as a function of radial distance. The red pentagrams represent the northern OB-type stars, and the black pentagrams is the southern OB-type stars. The green triangles show the thin disk scale height of Wang et al. (2018b), and the green rectangles show the thick disk scale height of Wang et al. (2018b). Brown and blue lines are the thin disk and thick disk of López-Corredoira & Molgó (2014), respectively. The yellow line shows the results of López-Corredoira et al. (2002). These data compared here originate from the same regions, and the average slopes describing the strength of the flaring are labeled in the bottom left, with different colors corresponding to different results.
Other Images in This Article

Copyright and Terms & Conditions
© 2021. The American Astronomical Society. All rights reserved.