Image Details
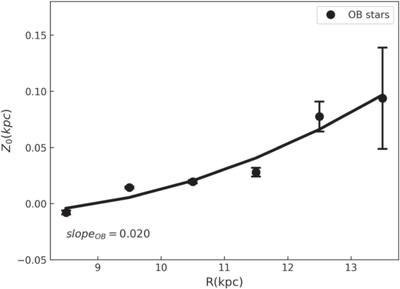
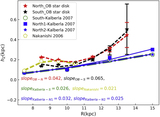
Caption: Figure 6.
The figure displays the midplane displacement distribution as a function of R. Almost all values are within 100 pc, and the slope shown in the bottom left is 0.020. Please notice that the slope is just for a quantitative analysis, and is different from the flaring strength.
Other Images in This Article

Copyright and Terms & Conditions
© 2021. The American Astronomical Society. All rights reserved.
Copyright ©
2025 Astronomy Image Explorer. All Rights Reserved.