Image Details

Caption: Figure 7.
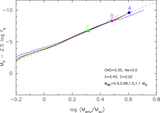
(a) Scaling mass Msc against WD mass MWD for various chemical compositions. The filled black stars connected by a black line show the models in Table 3 (solar composition). The filled blue triangles connected by a blue line denote the models in Table 2 (Ne2). The open red squares connected by a red line correspond to the models in Table 1 (CO3). The CO3 has X = 0.45, Y = 0.18, Z = 0.02, ﹩{X}_{{\rm{C}}}=0.15﹩, and ﹩{X}_{{\rm{O}}}=0.20﹩ by mass weight. The Ne2 is composed of X = 0.55, Y = 0.30, Z = 0.02, ﹩{X}_{{\rm{O}}}=0.10﹩, and ﹩{X}_{\mathrm{Ne}}=0.03﹩. (b) Same as panel (a), but we shift the WD masses of the chemical composition Ne2 by ﹩+0.12\,{M}_{\odot }﹩ and CO3 by ﹩+0.19\,{M}_{\odot }﹩, as plotted in the figure. These three lines overlap well until ﹩1.2\,{M}_{\odot }﹩.
Other Images in This Article
Copyright and Terms & Conditions
© 2020. The American Astronomical Society. All rights reserved.