Image Details
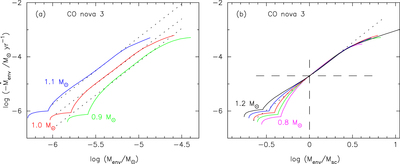
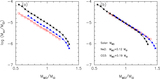
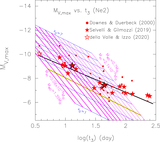
Caption: Figure 3.
(a) Envelope mass decreasing rate vs. hydrogen-rich envelope mass of optically thick wind (or static) solutions for three WD masses with the chemical composition of CO3. The solid blue, red, and green lines denote 1.1, 1.0, and ﹩0.9\,{M}_{\odot }﹩ WD models, respectively. The break of each line corresponds to ﹩{M}_{\mathrm{cr}}﹩, at which optically thick winds stop. The dotted lines indicate the global trends of ﹩{\dot{M}}_{\mathrm{env}}﹩–Menv relations. (b) The ordinate is the same, but the horizontal axis is scaled by each scaling mass Msc, where the scaling mass is defined by each envelope mass having ﹩\mathrm{log}(-{\dot{M}}_{\mathrm{env}}/{M}_{\odot }\,{\mathrm{yr}}^{-1})=-4.7﹩. Two other WD mass models are added, i.e., 0.8 (magenta) and 1.2 (black) M☉. The horizontal dashed line denotes the envelope mass decreasing rate of ﹩\mathrm{log}(-{\dot{M}}_{\mathrm{env}}/{M}_{\odot }\,{\mathrm{yr}}^{-1})=-4.7﹩, while the vertical dashed line indicates each scaling mass.
Other Images in This Article
Copyright and Terms & Conditions
© 2020. The American Astronomical Society. All rights reserved.