Image Details
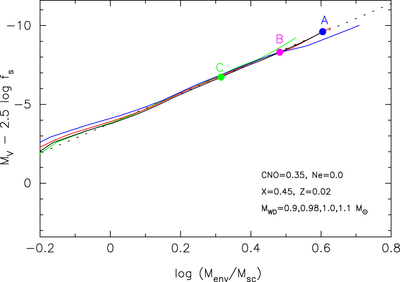
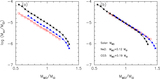
Caption: Figure 4.
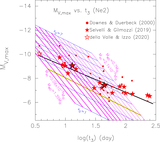
Free–free emission model V light curves plotted against ﹩{M}_{\mathrm{env}}/{M}_{\mathrm{sc}}﹩ for the 0.90 (green), 0.98 (black), 1.0 (red), and 1.1 (blue) M☉ WDs. The absolute V magnitude is calibrated with the V1668 Cyg light curve (Hachisu & Kato 2016). Points A, B, and C are the same as those in Figure 1 and specified by ﹩{x}_{0}\equiv {M}_{\mathrm{env},0}/{M}_{\mathrm{sc}}=4.0﹩, 3.1, and 2.1, respectively, on the ﹩0.98\,{M}_{\odot }﹩ WD model. The dotted line represents an approximate relation of Equation (12).
Other Images in This Article
Copyright and Terms & Conditions
© 2020. The American Astronomical Society. All rights reserved.
Copyright ©
2025 Astronomy Image Explorer. All Rights Reserved.