Image Details
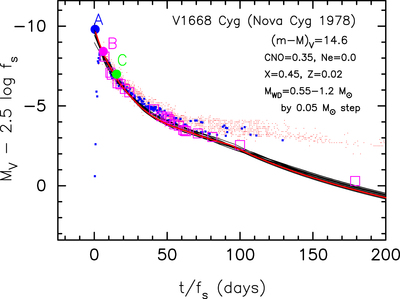
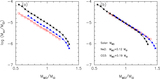
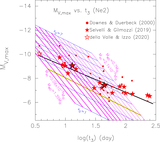
Caption: Figure 1.
Comparison of our model V light curves with the V1668 Cyg light curve. A ﹩0.98\,{M}_{\odot }﹩ WD (CO3) model (solid red line) reasonably reproduces the V1668 Cyg optical y (open magenta squares) and V (filled blue squares) light curves. We add the visual magnitudes (red dots) of V1668 Cyg. The distance modulus in the V band of ﹩{\mu }_{V}\equiv {(m-M)}_{V}=14.6﹩ is taken from Hachisu & Kato (2019a). The data are all the same as in Figure 46 of Hachisu & Kato (2018). Free–free emission model V light curves for 0.55, 0.60, 0.65, 0.70, 0.75, 0.80, 0.85, 0.90, 0.95, 1.0, 1.05, 1.1, 1.15, and ﹩1.20\,{M}_{\odot }﹩ WDs (solid black lines) are plotted in the ﹩(t/{f}_{{\rm{s}}})﹩–﹩({M}_{V}-2.5\mathrm{log}{f}_{{\rm{s}}})﹩ plane. The time-normalization factor ﹩{f}_{{\rm{s}}}﹩ of each model, tabulated in Table 3 of Hachisu & Kato (2016), is measured against that of the V1668 Cyg light curves. We place three points, A, B, and C, on the model V light curve (﹩0.98\,{M}_{\odot }﹩), corresponding to three different initial envelope masses: ﹩{M}_{{\rm{e}}{\rm{n}}{\rm{v}},0}=1.8\times {10}^{-5}﹩, ﹩1.4\times {10}^{-5}﹩, and ﹩0.94\times {10}^{-5}\,{M}_{\odot }﹩, respectively. Point B is the optical peak of V1668 Cyg, ﹩{m}_{V,\max }=6.2\,({M}_{V,\max }=6.2-14.6=-8.4)﹩.
Other Images in This Article
Copyright and Terms & Conditions
© 2020. The American Astronomical Society. All rights reserved.