Image Details
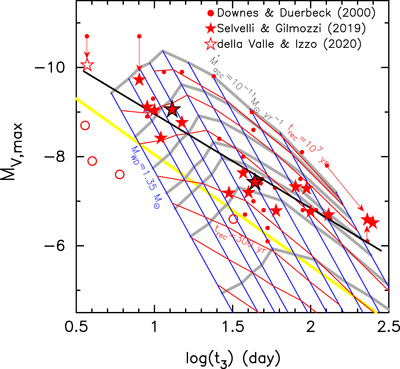
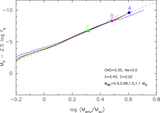
Caption: Figure 6.
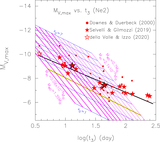
Same as Figure 5 but for equi-MWD, equi-﹩{\dot{M}}_{\mathrm{acc}}﹩, and equi-trec models of solar abundance. The thin blue lines connect the same WD mass MWD but for different mass accretion rates ﹩{\dot{M}}_{\mathrm{acc}}﹩. The WD masses are, from right to left, MWD = 0.6, 0.7, 0.8, 0.9, 1.0, 1.1, 1.2, 1.25, 1.3, and ﹩1.35\,{M}_{\odot }﹩. The thick yellow line corresponds to the x0 = 2 line. The thin red lines connect the same recurrence time, i.e., ﹩{t}_{\mathrm{rec}}=30﹩, 100, 300, 1000, 10000, 105, 106, and 107 yr, from bottom to top. The thick gray lines represent the same mass accretion rate, from bottom to top, ﹩{\dot{M}}_{\mathrm{acc}}=3\times {10}^{-8}﹩, ﹩1\times {10}^{-8}﹩, ﹩5\times {10}^{-9}﹩, ﹩3\times {10}^{-9}﹩, ﹩1\times {10}^{-9}﹩, ﹩1\times {10}^{-10}﹩, and ﹩1\times {10}^{-11}\,{M}_{\odot }﹩ yr−1. See Table 4 for data. The four open red circles denote the MMRD positions of the four recurrent novae, CI Aql, T CrB, U Sco, and V745 Sco. Other symbols and lines are the same as those in Figure 5. See text for more details.
Other Images in This Article
Copyright and Terms & Conditions
© 2020. The American Astronomical Society. All rights reserved.