Image Details
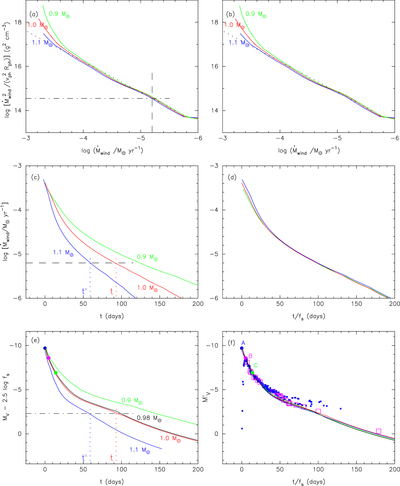
Caption: Figure 2.
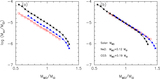
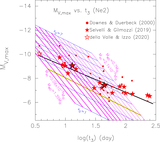
(a) and (b) Free–free flux parameter of ﹩{\dot{M}}_{\mathrm{wind}}^{2}/({v}_{\mathrm{ph}}^{2}{R}_{\mathrm{ph}})﹩ vs. wind mass-loss rate ﹩{\dot{M}}_{\mathrm{wind}}﹩ for 1.1 (blue), 1.0 (red), and 0.9 (green) M☉ WD (CO3) models, which are the same models as in Figure 1. The three (blue, red, and green) lines almost overlap each other. The dotted lines indicate the global trend of these three lines. (c) and (d) Wind mass-loss rates plotted against real time t and normalized time ﹩t/{f}_{{\rm{s}}}﹩, respectively, for the same three WD mass models. (e) and (f) Free–free emission model V light curves for the 0.90 (green), 0.98 (black), 1.0 (red), and 1.1 (blue) M☉ WDs plotted against real time t and normalized time ﹩t/{f}_{{\rm{s}}}﹩, respectively. In panel (e), the right edge of the ﹩1.1\,{M}_{\odot }﹩ light curve (blue line) corresponds to the end of the wind phase. Note that the ordinate in panel (f) is ﹩{M}_{V}^{{\prime} }[t^{\prime} ]﹩ in Equation (1), corresponding to the abscissa of ﹩t^{\prime} =t/{f}_{{\rm{s}}}﹩, while the ordinate in panel (e) is ﹩{M}_{V}[t]-2.5\mathrm{log}{f}_{{\rm{s}}}﹩ because the abscissa is t. The symbols in panels (e) and (f) are the same as those in Figure 1. See the text for more details.
Other Images in This Article
Copyright and Terms & Conditions
© 2020. The American Astronomical Society. All rights reserved.