Image Details
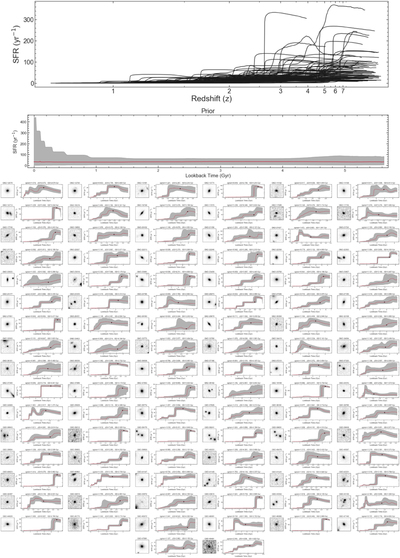
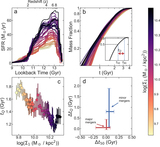
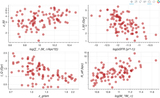
Caption: Figure A2. Galaxy cutouts and SFHs
The complete figure set (98 images) is available in the online journal.
Galaxy cutouts and SFHs (ordered by formation redshift) for the sample of galaxies. The first plot shows all SFHs, plotted at their appropriate redshifts. The second plot shows the prior we used to fit our nonparametric SFHs. The following plots are then the galaxy cutouts and SFHs for each galaxy, with their formation redshift marked with a point, and relevant information shown at the top of the figure.
Other Images in This Article
Copyright and Terms & Conditions
© 2020. The American Astronomical Society. All rights reserved.
Copyright ©
2024 Astronomy Image Explorer. All Rights Reserved.