Image Details
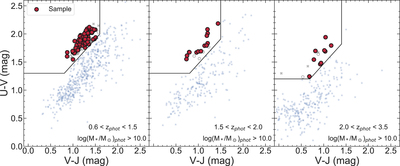
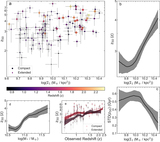
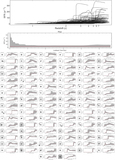
Caption: Figure 1.
V − J vs. U − V rest-frame color–color diagram (“UVJ” plot) of all CLEAR galaxies with 0.6 < zphot < 3.5 and ﹩\mathrm{log}({M}_{\mathrm{phot}}/{M}_{\odot })\gt 10.0﹩. Galaxies that fall into the quiescent wedge (upper left region in each panel) are candidate quiescent galaxies and constitute our parent sample. The red larger points show galaxies that satisfy our final sample selection of 0.7 < zgrism < 2.5 and ﹩\mathrm{log}({M}_{\mathrm{grism}}/{M}_{\odot })\gt 10.5﹩ (and satisfy our X-ray and 24 μm selection, see Section 2.1). Blue stars show galaxies that fail the quiescent galaxy selection (i.e., they are star-forming galaxies). Gray X’s mark quiescent galaxies that were rejected (mostly because they have grism redshifts outside our final redshift range). Open gray circles show quiescent galaxies that are rejected for falling under our final stellar-mass limit ﹩\mathrm{log}({M}_{* }/{M}_{\odot })\gt 10.5﹩.
Other Images in This Article
Copyright and Terms & Conditions
© 2020. The American Astronomical Society. All rights reserved.