Image Details
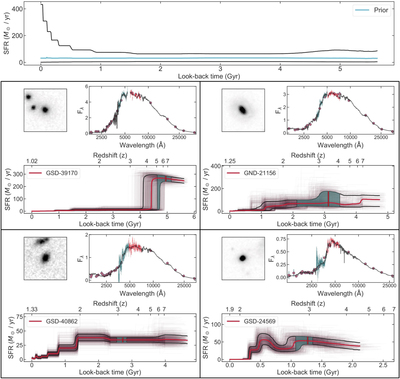
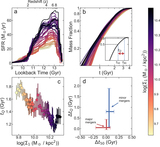
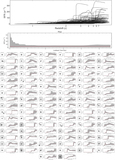
Caption: Figure 2.
Example SED fits to galaxies from our sample. Each set of bottom four subpanels shows results for one galaxy (with CLEAR IDs labeled). The top subpanel shows the shape of the prior used for the SFH (median in blue and the 68% credible region in black). The prior shown is specifically for a galaxy at z = 1.02 with stellar mass ﹩\mathrm{log}M/{M}_{\odot }=11.40﹩ (like GSD-39170), and changes to the redshift and stellar mass affect the span of the SFH (set by redshift) and SFR normalization (set by mass); the overall shape of the prior is the same for all galaxies. In each of the following subpanels, the top-left subpanels shows a 4″ × 4″ F160W image centered on the galaxy. The top right subpanels show the full SED, including the broadband photometry (purple circles) and WFC3 grism spectra (blue line: WFC2/G102; red line: WFC3/G141) along with the median FSPS stellar population model from the posterior (black line). The bottom figure in each subpanel shows the derived SFH. The purple lines show individual draws for the SFH, the thick red line shows the median, and the thick black lines show the 68% credible interval. The vertical red line shows ﹩{z}_{50}﹩, the formation redshift (where 50% of the stellar mass had formed), and the green-shaded region shows the 68% highest density region on ﹩{z}_{50}﹩. In Appendix A we provide a hyperlink to, and a description of, an online appendix that contains similar fits and information for all the galaxies in our sample.
Other Images in This Article
Copyright and Terms & Conditions
© 2020. The American Astronomical Society. All rights reserved.