Image Details
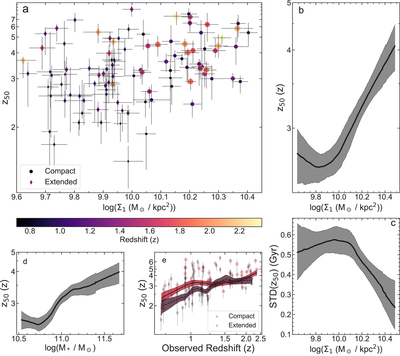
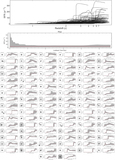
Caption: Figure 5.
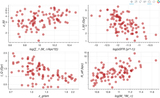
Relationship between formation redshift ﹩{z}_{50}﹩ (the redshift by when 50% of the stellar mass had formed), the observed redshift zgrism, and Σ1 (the stellar-mass surface density within 1 pkpc). (a) shows ﹩{z}_{50}﹩ as a function of ﹩\mathrm{log}({{\rm{\Sigma }}}_{1})﹩ for the quiescent galaxies in our sample. Galaxies with ﹩\mathrm{log}{{\rm{\Sigma }}}_{1}/({M}_{\odot }{\mathrm{kpc}}^{-2}))\gt 10﹩ (﹩\lt 10﹩) are shown as circles (diamonds). The color and size of the all points scales with increasing zgrism. Galaxies with ﹩\mathrm{log}{{\rm{\Sigma }}}_{1}/({M}_{\odot }{\mathrm{kpc}}^{-2})\lt 10﹩ span a larger range of ﹩{z}_{50}﹩. Galaxies with log Σ1 / (M⊙ kpc−2) > 10 favor higher formation redshifts of ﹩{z}_{50}\gt 3﹩. (b) shows the change in ﹩{z}_{50}﹩ as a function of ﹩\mathrm{log}({{\rm{\Sigma }}}_{1})﹩ using the Locally Weighted Scatterplot Smoothing (LOWESS) algorithm with bootstrapping to estimate the 68% confidence region. (c) shows the scatter in ﹩{z}_{50}﹩ as a function of ﹩\mathrm{log}({{\rm{\Sigma }}}_{1})﹩ (using LOWESS). Galaxies with higher Σ1 tend toward higher ﹩{z}_{50}﹩ with lower scatter. (d) shows the change in ﹩{z}_{50}﹩ as function of ﹩\mathrm{log}{({M}_{* }/{M}_{\odot })}_{\mathrm{grism}}﹩ using LOWESS. Higher mass galaxies tend toward higher ﹩{z}_{50}﹩, though this relation is less steep while there is a continued rise between ﹩{z}_{50}﹩ vs. the stellar-mass surface density, Σ1. (e) shows the formation redshift, ﹩{z}_{50}﹩, against the observed redshift. Galaxies with ﹩\mathrm{log}({{\rm{\Sigma }}}_{1})﹩/ ﹩({M}_{\odot }\,{\mathrm{kpc}}^{-2})\gt 10﹩ (﹩\lt 10﹩) are indicated by red (purple) points, using the LOWESS algorithm to show the trend. We see here that more compact galaxies (i.e., with higher Σ1) tend to have higher z50, particularly for ﹩z\lesssim 1.25﹩.
Other Images in This Article
Copyright and Terms & Conditions
© 2020. The American Astronomical Society. All rights reserved.