Image Details
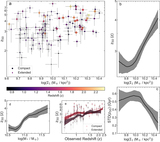
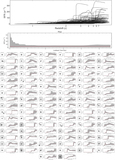
Caption: Figure 3.
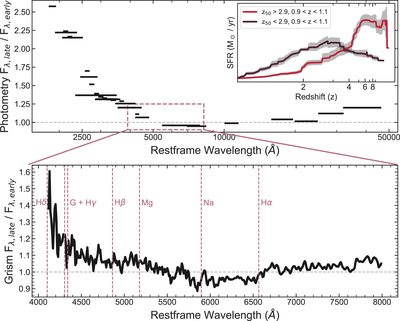
Comparison between the photometric and spectroscopic (grism) data for the subset of our quiescent galaxies at ﹩0.9\lt {z}_{\mathrm{grism}}\lt 1.1﹩, split by their measured formation redshift (z50, where 50% of their stellar mass had formed). The two groups are ﹩{z}_{50}\lt 2.9﹩ (late-forming galaxies) and ﹩{z}_{50}\gt 2.9﹩ (early forming galaxies). The top plot shows the ratio of the median flux densities measured in each broadband photometric band for the late-forming sample to the early forming sample. The biggest difference occurs at rest UV wavelengths, which indicates the late-forming galaxies show evidence of more recently formed stars (which contributes to the lower z50). The bottom panel shows a ratio of their stacked combined G102+G141 grism spectra. Dashed vertical lines show wavelengths of common spectral features. For both the top and bottom panels we normalize the stacks/medians at 6000–6500 Å in the rest frame. The inset in the top panel shows a mean stack of the SFHs for the late-forming and early forming galaxies (as labeled). When comparing the two SFHs we can see that the SFH of the ﹩{z}_{50}\gt 2.9﹩ subsample has the majority of mass formed more rapidly with a steeper decline, while the SFH of the ﹩{z}_{50}\lt 2.9﹩ subsample has a more gradual decline in SFR (with more star formation in the recent past).
Other Images in This Article
Copyright and Terms & Conditions
© 2020. The American Astronomical Society. All rights reserved.