Image Details
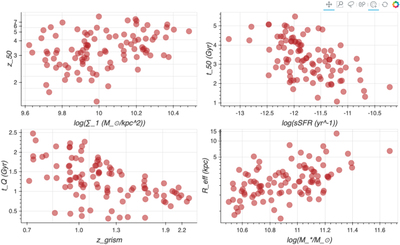
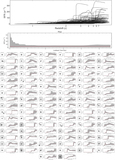
Caption: Figure A1.
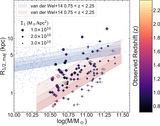
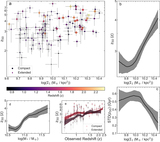
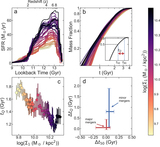
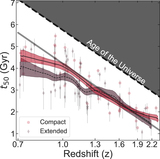
The relationship between formation redshift (z50)–log stellar surface mass density within 1 kpc (﹩\mathrm{log}({{\rm{\Sigma }}}_{1})﹩) (top left), age (t50)–log sSFR (top right), quenching timescale (tQ)–redshift (zgrism) (bottom left), and size (Reff)–log mass (﹩(\mathrm{log}{M}_{\odot })﹩) (bottom right). At the top right of the interactive plots there are several buttons that allow one to interact with the figures. These include (in order) tools to pan the figure, zoom in, select multiple points (lasso tool), scroll zoom, click on points (tap tool), and a tool to refresh the plots. Points selected with the lasso tool will be highlighted on all plots. Hovering over a point will bring up the galaxy’s properties (appropriate to the plot). Clicking on a point will open a biographical page, including a morphology, interactive SFH, and interactive spectrum plot (with best-fit spectrum). The interactive galaxy pages include the ability to pan and zoom to explore the data.
An interactive version of this figure is available in the online journal.
Other Images in This Article
Copyright and Terms & Conditions
© 2020. The American Astronomical Society. All rights reserved.