Image Details
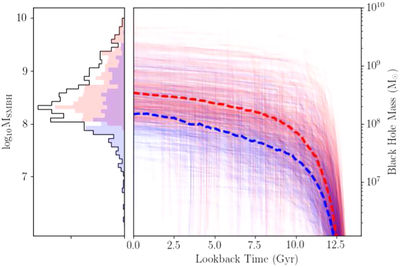
Caption: Figure 5.
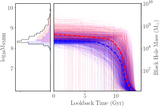
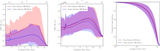
Main panel: the evolution of the MBH (bottom) of galaxies with σ > 100 km s−1 in Illustris. Red shows the galaxies with overmassive SMBHs and blue shows galaxies with undermassive SMBHs. Faint lines show the trajectory of individual galaxies. Thick dashed lines connect the median values of the two populations at each lookback time. The dips (downward trend followed by a sudden increase) represent a misidentification of the main progenitor, which can occur during mergers (Rodriguez-Gomez et al. 2015). The small panel on the left shows the distribution of MBH at z = 0. Again, red shows the galaxies with overmassive SMBHs and blue shows galaxies with undermassive SMBHs. The black line shows the mass distribution of all the SMBHs in galaxies with σ > 100 km s−1 in Illustris.
Other Images in This Article
Copyright and Terms & Conditions
© 2020. The American Astronomical Society. All rights reserved.