Image Details
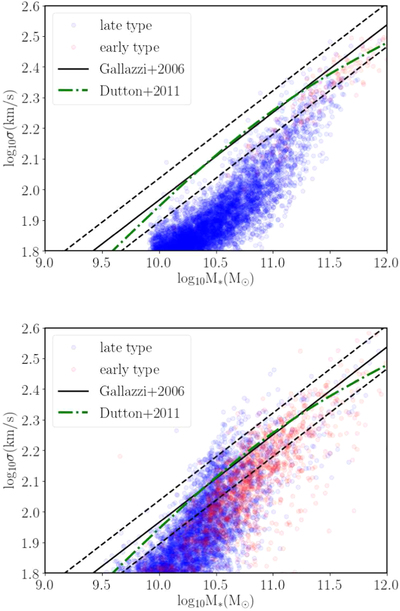
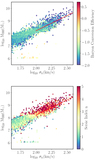
Caption: Figure 2.
The relation between stellar velocity dispersion σ and stellar mass M* for galaxies in Illustris (top) and TNG100 (bottom). Blue dots show late-type galaxies (defined as those with Sérsic indices smaller than 4), and red dots show early-type galaxies (Sérsic indices ﹩\geqslant ﹩ 4). The solid black line is the linear fit to the Faber Jackson Relation in Gallazzi et al. (2006) for early-type galaxies with R90/R50 > 2.8 in the Sloan Digital Sky Survey (SDSS) Data Release 2 (Abazajian et al. 2004) and dashed lines show the scatter. The dotted–dashed green line shows the best fit for the early-type galaxies in SDSS Data Release 7 (Abazajian et al. 2009) using a double power law (Dutton et al. 2011). For a given M*, σ tends to be low in simulations, and the discrepancy is larger in Illustris. Massive galaxies in TNG100 agree reasonably well with the observations, although with a tendency toward low σ at a given M*.
Other Images in This Article
Copyright and Terms & Conditions
© 2020. The American Astronomical Society. All rights reserved.