Image Details
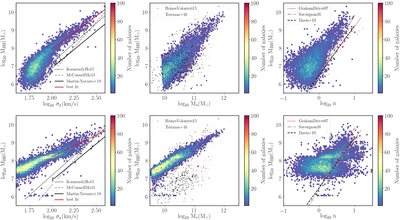
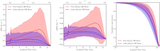
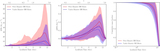
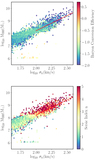
Caption: Figure 1.
SMBH–host galaxy correlations in Illustris (top) and TNG100 (bottom) simulations. The left panels show the MBH–σ relation compared with the observed best-fitting relations (Kormendy & Ho 2013; McConnell & Ma 2013; Martín-Navarro et al. 2018). The middle panels show the MBH–M* relation compared with the observed data in Reines & Volonteri (2015) and Terrazas et al. (2016). The right panels show the correlation between MBH and Sérsic index compared with the linear best-fitting relations from Graham & Driver (2007), Savorgnan (2016), and Davis et al. (2019) for the observed galaxies. Also plotted are the data points from Graham & Driver (2007). For clarity, the error bars of the observed data are not plotted here. Simulation data only include galaxies with M* ≳ 1010M⊙ for Illustris and M* ≳ 5 × 10⁹M⊙ for TNG100.
Other Images in This Article
Copyright and Terms & Conditions
© 2020. The American Astronomical Society. All rights reserved.