Image Details
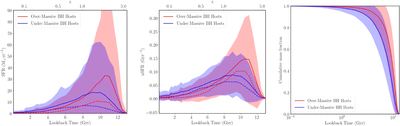
Caption: Figure 3.
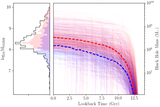
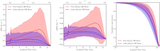
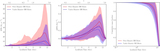
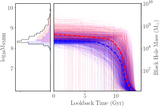
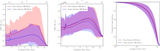
Star formation history of massive galaxies (σ > 100 km s−1) in Illustris. The left panel shows star formation rate as a function of lookback time. Red shows the galaxies with overmassive SMBHs and blue shows galaxies with undermassive SMBHs as defined in Section 4.1. Within each lookback time bin, we fit a normal distribution to the SFR distribution of each population, and the mean is shown as solid lines. The shaded regions are the 1σ range. The dashed lines show the median values for the two populations. The middle panel shows the star formation rate normalized by the current-day stellar mass. The right panel shows the cumulative mass fraction as a function of lookback time, color coded in the same way as the top panel. Similar to the observed massive galaxies in Martín-Navarro et al. (2018), the hosts of overmassive SMBHs have formed earlier and have had suppressed star formation for longer in Illustris.
Other Images in This Article
Copyright and Terms & Conditions
© 2020. The American Astronomical Society. All rights reserved.