Image Details
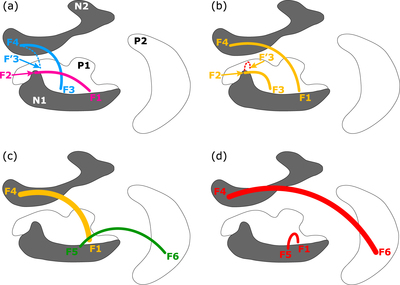
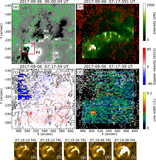
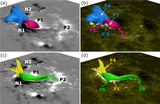
Caption: Figure 9.
Schematics of magnetic field lines before and after the onset of the X2.2 and X9.3 flares. All the images depict AR as seen from the southeast (i.e., from the lower left in the images of Figure 2), similar to that in Figure 8. The colored lines in panels (a) and (c) represent the same colored tubes as in Figures 8(a) and (c) and correspond to the snapshots before the onset of the X2.2 and X9.3 flares, respectively. The red and yellow solid lines in panels (b) and (d) indicate the magnetic field lines after the onset of the X2.2 and X9.3 flares. The small red dashed line loop corresponds to the cusp-shaped brightening depicted in Figures 4 and 6.
Other Images in This Article
Copyright and Terms & Conditions
© 2020. The American Astronomical Society. All rights reserved.